GRRumbling About Retention Metrics, or, Pitfalls in Measuring SaaS Churn
April 8, 2025
Revenue retention – whether Gross Revenue Retention (GRR) or Net Revenue Retention (NRR) – is the most prominent SaaS-specific metric in our industry. At its best, retention can quickly paint a picture of the health of a SaaS company and give a useful view of both relative and absolute performance.
Retention is sometimes very easy and straightforward to calculate. Before we get into the more difficult scenarios, let’s play on “easy mode” and consider the case of a pure subscription software company.
I. Easy Mode: Revenue Retention in a “pure” SaaS Company
The basic retention calculation: per-customer data, year over year.
For two periods, take the sum of all second-period revenue from customers in the first period who are still customers in the second period, and divide by the total first-period revenue – that’s Net Revenue Retention (NRR). If you tweak it by capping the second-period revenue at the level of the first-period revenue for each customer – that is, not including any “upsells,” – you get Gross Revenue Retention (GRR). GRR is always strictly less than or equal to NRR.
The important thing to remember here is that you must use per-customer data to compare periods, and only sum the customers after you’ve compared periods. Using the sum of all customers before you compare periods will cover up losses from some with gains from others, and makes it hard to segregate new customers from retained ones. It may seem nice to have a higher number, but it will prevent management from having a clear picture (and a sophisticated outsider like an investor or buyer will demand a per-customer re-calculation anyhow).
The following illustrates the principle of comparing period p1 to p2 using per-customer data for NRR (which gives credit for the revenue at p2) and GRR (which uses the lesser of the two):
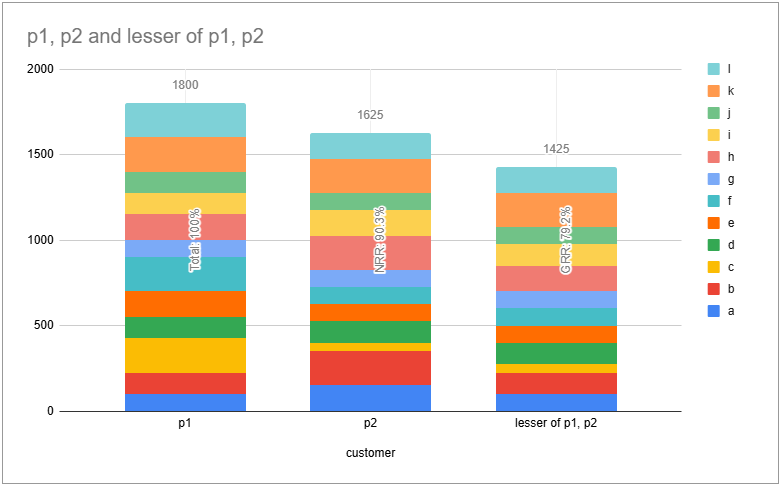
Here, p2 / p1 is 90.3%, which is our NRR. Dividing the lesser of p1 and p2 over p1 gives us 79.2%, which is the GRR. Simple enough! (But stay tuned.)
You can do this calculation for whatever periods you like, and it’s not uncommon to see yearly, monthly, and sometimes quarterly. Generally, periods below a year apart will need to be annualized to get a useful value. We feel strongly, however, that the best choice of period size for retention comparison is the smallest unit in which revenue recognition takes place, and the best choice of the time between periods is the time over which you want to measure the retention. That means in practice: use monthly data, compared one year apart. This avoids the volatility and guesswork that can come from annualizing a month-to-month figure, and it also gives the purest (and sometimes harshest) reflection of volatility.
Recommendation: use month-over-year-ago-month
If you’re accruing monthly recurring revenue “by the book” – that is, according to GAAP and ASC606 – we strongly recommend tracking month-over-year-ago-month as the unit of retention tracking. Here’s an illustration of why using longer periods, like full years, is harmful. Consider a two-year history of a ten-customer SaaS company. Five of those customers, however, cancel in the last quarter of the second year. If you take annual totals, here’s what the gross retention looks like:
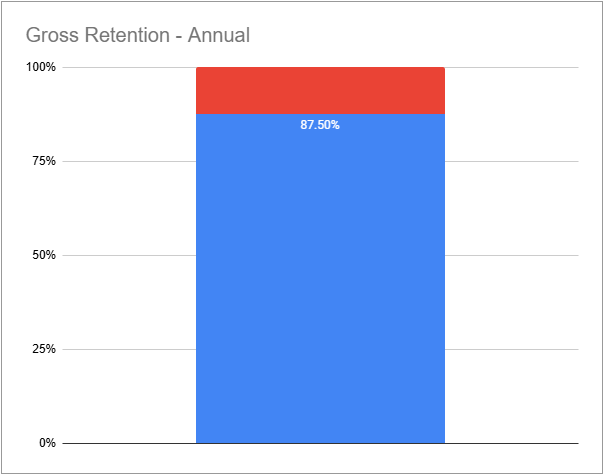
Not too bad – 87.5% GRR might be a respectable number. But this 12-month aggregation obscures a crucial fact: in the last quarter, gross retention was nowhere near 87%. Here’s what it looks like monthly, instead:
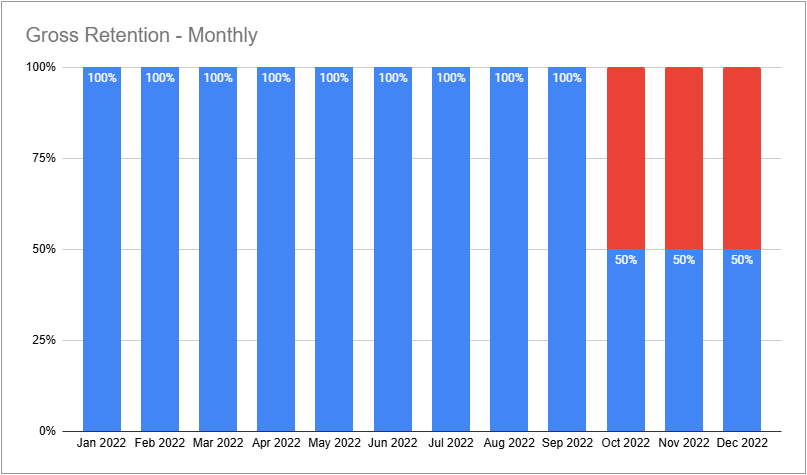
This paints a very different picture: GRR was 100% up until Q4, when it took a dive to 50%. What does that mean? Who knows: it might be a disaster, or it might be just a normal challenge to work through. But either way, the monthly granularity tells a much different story, and if you were in charge of running, advising, or investing in this business, you would much rather see the monthly graph than the annual one.
In sum:
- Using the smallest period of time is the most revealing. In practical terms that means monthly.
- Aggregating monthlies into an annual measure can obscure underlying changes.
Recommendation: use one year as your comparison gap
Sometimes, SaaS companies will use monthly (or quarterly, etc.) periods, but instead of comparing a period to the year-ago period, they’ll compare consecutive monthly periods. For example, if you had $100 in recurring revenue in January, and $98 in February from those same customers, they would consider it “98% monthly NRR.” (It’s a little more common to see this idea expressed as “2% monthly churn”, which is one minus the retention percentage.)
Monthly (that is, month-over-prior-month, not month-over-year-ago-month as we recommend) is not totally irrational, but it has one huge challenge: how do you meaningfully compare it to an annual value?
The usual way to annualize a monthly retention percentage is to “compound” it, the same way you might compound monthly interest in a savings account (except that values less than 100% will compound by shrinking instead of growing).
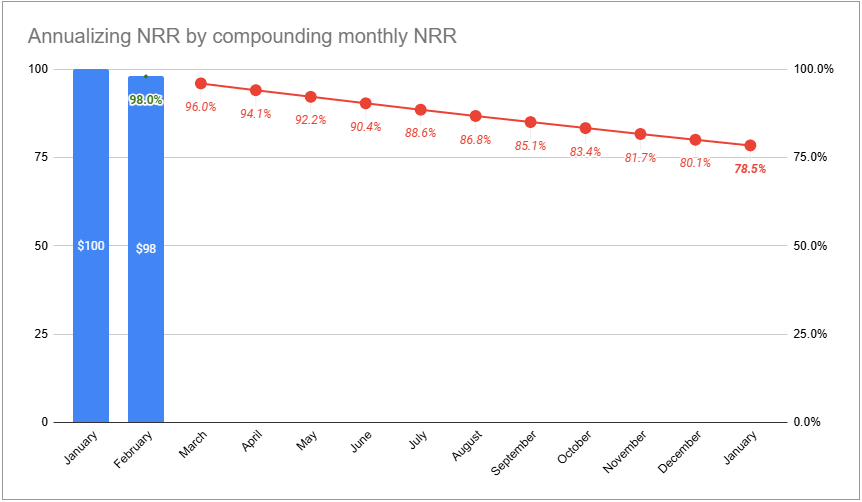
In the figure above, you can see that 98% monthly NRR, annualized January-to-January by compounding, works out to 78.5% annual NRR.
A key issue with this approach, however, is that it’s extremely sensitive to which two months you use. For example, if you have a smallish number of customers, it’s common to have a month where you don’t lose any customers, even if you would actually expect to lose a few customers over a year. If you choose the “perfect” month-over-month retention to compound, you’ll get a misleading 100% annualized retention figure. If you lose one equal-sized customer a year (92% GRR), annualizing the one month when you lose that customer will make your GRR seem like 35% (!!). And even a very mild seasonality in revenue will throw compounded month-over-month figures completely out of whack.
Quarterly is a little bit less prone to this problem. Still, unless there’s a very good reason, you should compare periods (ideally months) to year-ago periods.
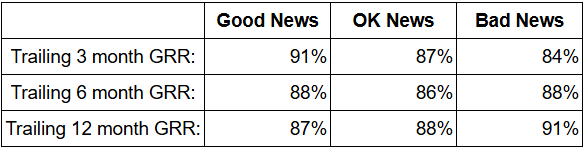
Recommendation: Look at 3-, 6-, and 12- month trailing averages
You’ve calculated GRR and NRR for month-over-year-ago-month, and you may notice some ongoing volatility. That’s OK; some of the same dynamics with month-over-prior-month will be in play, but they won’t be magnified by the annualizing calculation (see above).
The (usually) best way to even out month-over-year-ago-month retention numbers is to take an arithmetic average over 3, 6, and 12 months, if you have enough data history. This will indicate whether the metric is improving, declining, or staying about the same, over enough of a timeframe to be meaningful while also being useful to guide quarter-to-quarter operational changes (e.g. is our new retention strategy we started six months ago working?)
Recommendation: Save sophisticated cohort analysis for deep dives.
A powerful tool for understanding change in the population of customers acquired at different times is to do a cohort retention waterfall. This approach can give powerful insights into sales and marketing strategies. For example, say in 2019-2021 customers mainly came from trade shows, but in 2022 an outbound telesales strategy was begun. Using data in 2025, you could compare the 2-year drop off of customers acquired in 2021 to those in 2022 to show the relative quality and longevity of customers acquired under either strategy. This is a powerful tool.
Save this kind of analysis for an internal deep dive into S&M performance, or for equity due diligence, to compare one cohort to another within your dataset. However, because there are so many different ways you could tweak a cohort analysis, it’s awfully hard to make an apples-to-apples comparison with other companies, making this of limited broader use. For most investors and lenders, and for most management purposes, GRR and NRR are strong enough, and commensurable, key performance indicators.
Recommendation: Start with pure recognized subscription revenue
Start with your recurring subscription revenue in its purest form. Support contracts that are only sold to subscription software customers and recur on the same terms are generally OK to include in subscription recurring revenue (though you should also track them separately for gross margin purposes).
If you have re-occurring revenues that 1. are received only from subscription software customers, and 2. make up a small minority of the pure subscription revenue, it’s often OK to lump them into recurring revenue. A good rule of thumb is a maximum of 20% of what is counted as ARR should come from “impure” sources in order to casually describe the figure as “ARR” without more of an explanation. These would be things like minor usage-based overage charges, etc.
Setup and implementation revenue is a little touchy. The strict way to handle this under US GAAP (and ASC Topic 606) involves determining if the setup revenue is truly independent of the SaaS contract and possibly spreading it over a contract term. Regardless of how you account for it, though, if it’s really just one-time revenue at the beginning of a contract, don’t include it in ARR for retention purposes. Consider: if you charge $90,000 for a subscription and a $10,000 implementation fee, assuming a straight renewal of the subscription only, including the implementation revenue in the first year would make the second year look like a drop in revenue, a 90% GRR instead of a 100% GRR.
You should generally not include the following items in recurring revenue: hardware sales, pass-through revenue, custom development, and transactional or usage-based revenue that tends to vary more than about 10% month-to-month.
Be aware that the less “pure” the recurring revenue figure used for retention, in general, the lower the retention figures will be, because any variability in things like overage, services, etc., adds volatility, which in turn reduces retention (especially GRR).
Recommendation: Use accrual accounting for revenue recognition
This may seem obvious to a reader from a big-company background or with formal accounting training. But it bears stating, because many SaaS companies – particularly those who bill monthly at first – start out using cash accounting, and move to a “hybrid” accounting system as they find early traction and begin to professionalize their finance and accounting functions. That’s normal. But by the time a SaaS company approaches $5 M in ARR or seeks outside institutional funding, it’s time to be moving to accrual accounting.
The essential challenge for accrual revenue recognition (“rev rec” for short) is splitting up longer-term contracts into monthly units during which the revenue is earned, regardless of when cash is collected. (If you bill monthly to a credit card, the problem is hidden; you generally collect in the same month as you earn, so cash and accrual rev rec look the same.)
For more than a handful of customers, it becomes necessary to automate this process. QuickBooks Online (QBO) has a basic functionality for this (search for “revenue recognition schedule” in the help docs), but eventually, most growing SaaS companies use a built-for-purpose revenue recognition platform, such as Maxio (formerly SaaSOptics). Chargebee is another such platform, more focused on B2C or smaller SaaS companies.
Eventually, it’s easier to do this “right” by implementing the full accrual method. The details of how to implement accrual accounting are beyond the scope of this piece. (You will likely want a controller- or CFO-level professional with experience in this area, even as an outsourced resource, in order to get this setup right.)
What we don’t recommend is presenting your MRR using any kind of “clever” accruals, which we occasionally see when a more sophisticated CFO tries to optimize around taxation. These approaches, in theory, can let you delay or extend recognizing the revenue for tax purposes. Save these games for when your company is well over $10 M ARR and profitable, since income taxes are rarely in play for smaller, loss-making companies.
Recommendation: P&L MRR should ideally match retention calculation MRR
If you have a relatively pure SaaS company, if you use accrual accounting, and you follow the recommendations above, the monthly P&L “recurring revenue” line should equal the sum of the monthly revenue contained in the retention calculation.
Avoid using “booked” or “committed” recurring revenue that is not yet recognized (“earned”) for your retention calculations. There’s a reasonable argument that booked MRR or “CMRR” is a good measure to use for certain SaaS companies, such as those with high growth rates or with long implementation cycles from closing to fully going live. In such cases, bookings or CMRR figures can be a better guide to the current period and the very recent past.
However, if you’re following our recommendations above, comparing month-over-year-ago-month, the very recently added customers won’t matter, and it will be harder to follow and check against the P&L. So, stick to earned (accrued) revenue for retention calcs.
II. The Real World: Challenging Scenarios for SaaS Retention Calculation
In the “Easy Mode” version of SaaS retention above, most of it came down to, “use GAAP recognized revenue and compare month-over-year-ago-month, averaged.”
That’s all well and good in theory, but in practice a lot of things depart from this ideal. Here’s our take on scenarios you may face in real life:
Scenario: Usage-Based Pricing Introduces Volatility
If more than a trivial amount of your pricing is based on usage, you will likely see a lower GRR measurement, all things considered. (The reason this should be OK in a situation that calls for usage-based pricing is, of course, that you will have higher NRR by allowing “automatic” upsell for heavy users.)
Seasonality can be particularly harsh in these models. A partial mitigation is to be sure to present 3-6-12 month trailing averages of GRR and NRR in addition to monthly values, and to go back as far as possible to capture the seasonal pattern in the data.
A simulation we ran comparing a company with 100% pure subscription revenue vs. a company with 95% subscription and 5% of their revenue being randomly variable (but the same on average) shows that the partly-variable company has a 1-2% lower GRR on average. A simulation with 75% subscription and 25% variable shows a 5-8% lower GRR. (Both cases would have the same average NRR, however.)
There’s not really any way around these trade-offs. It’s just going to be the case, and provided that the business fundamentally is SaaS-like in its “stickiness,” that’s OK. Someone evaluating the metrics is going to have to believe that you’ve made a good tradeoff of commitment to revenue predictability in exchange for upside of revenue growth, and make their peace with the lower GRR.
However, it also requires some self-examination and honesty from management. Do you want to be judged as a SaaS company (and shoot for SaaS-like valuation multiples)? Then be prepared for the tension of defending why your revenue should be considered recurring, instead of merely re-occurring, and present the math accordingly.
Scenario: Enterprise Customers are Slow to Sign Off on Renewals
Let’s say you sell annual contracts to large, slow-moving, compliance-minded entities. They might be very happy with your service, and you may have a good rapport with the actual users of the software, so you’re OK with the slow payment terms.
However, perhaps one customer requires a multi-level legal review and executive signoff on contracts, including annual renewals, and you’re now in month 14 and they still technically haven’t renewed the contract that expired in month 12. “Please keep providing the service, we assure you this will get renewed, it’s just our slow legal department,” your users tell you – and you believe them. However, what do you do about reporting retention?
For GAAP purposes, you have neither a contractual obligation nor cash in hand from this customer. Your auditor shouldn’t technically let you recognize that revenue. However, as a practical matter, you are still providing the service, the users are still using it, and you have a “verbal” that you fully expect to eventually get papered. We say, continue to record the as-if-renewed revenue monthly in your retention calcs, with a note. Here’s why.
Revenue gets recategorized, moved from period to period, etc. all the time, particularly around a periodic close or as part of an audit process. These adjusting journal entries are normal and, until a final version of a period’s financials is closed (usually a year’s worth), it’s somewhat expected that these minor changes will occur. Finally, unless the movement from month to month for a revenue entry crosses a year boundary, it’s unlikely to change the overall total.
Scenario: Refunds, Credits, and Dealmaking
Sometimes a customer asks for a full or partial refund and for whatever reason, it’s good business to give it to them. The best way to reflect this in your retention figures is to go back in time and amortize (or “un-amortize?”) the refund over the period that it reflects.
Let’s say a customer had a $12k ACV contract, for $1000 in MRR, but due to internal re-org turmoil, they never really implemented and launched during their first year. They agree to sign up for a second year but want a 50% refund on the first year since they didn’t use it. You grumble but agree. The best way to reflect this would be to go back and make it look like a $500 MRR customer throughout that first year. If you didn’t, and instead took a $6k refund charge in the 13th month, it would look like GRR took a huge dip in month 13, when in fact, month 13 should be a month of celebration (you kept the customer, and increased the “real” revenue from $500 to $1000).
For multi-year contracts, this could very well result in having to go back and restate previously calculated GRR and NRR of the period of the refund amortization. Usually, those aren’t numbers you want to go back and change, but in this case, it’s better to re-state the retention metrics over that period, rather than have an even more misleading dip/boost.
However, if you have at least hundreds of customers and the concentration is very small (nobody over 1% or so of total revenue) – you might consider skipping this process and letting the law of large numbers work for you. Another way to put it is, if you have a refund at least about once a month, it will “come out in the wash.”
Scenario: Trial or Onboarding periods
Some SaaS business models include either an explicit or an implicit trial period. That is, there may be a time at the beginning of a contract where – whether or not the customer is paying – there’s substantial uncertainty about whether they will really adopt the product on an ongoing basis.
If you have an explicit paid trial period of under six months, you should strongly consider excluding that from MRR for purposes of retention. Consider it one-time revenue, instead, and wait for successful trial customers to sign up for a full term before adding them to MRR for retention (and reporting trial revenue vs seasoned revenue as separate P&L lines).
It’s slightly trickier if you don’t have an explicit trial period, but you do have substantial uncertainty about whether new customers will stick around, making it like an implied trial period. Here, it might make sense to do some cohort analysis first, with a focus on seeing where the “breaking point” is in early churn. The key question should be, of the cohort who started at some month 0 and were paying in month N, what proportion churn out in month N+1? Hopefully, this churn number drops rapidly and approaches a steady state after the early quitters from a cohort have left. Once you have enough data to determine how long it takes to cull the early quitters, you have decided your implied trial or “seasoning” period. Say it’s four months: in that case, you should be calculating your “seasoned” retention (and ideally also reporting seasoned MRR separately on your P&L).
Another approach (which is similar to ICP or “regrettable churn” below) is to find a usage metric that separates the likely-to-quit low utilizers from the high utilizers and use that as your seasoning cutoff. The cutoff definition, like the seasoning period, should be objective and written down. (A surprisingly likely-to-be-effective cutoff for usage is literally “zero,” by the way.)
Scenario: Segment Rotation, Ideal Customer Profiles, and Non-Regrettable Churn
Many times, a SaaS business will discover that a customer segment where they had early tractions turns out not to be as attractive for growing the business. For example, maybe you started off selling into a low-growth vertical where the founders had a strong Rolodex but subsequently discovered demand among a much higher-growth vertical. Changing the company’s focus to the new vertical is likely to eventually alienate the old vertical and cause them to churn out, lowering historical GRR and NRR until the segment rotation is complete.
Sometimes this scenario gets called focusing on one Ideal Customer Profile; other times it’s more about getting rid of sub-ideal customers, when we’ve heard it called Non-Regrettable Churn. Either way, the key to making a useful retention measurement here is to be strictly honest and stick with an objective written definition of either ICP or Non-Regrettable churn. The board should approve of the definition and not let management change it month to month. (Eventually, you will probably compensate sales and customer success in part on these definitions, so you can’t let your reps put them into buckets based on gut feel or instinct.)
Like with seasoning of customers, segmenting of customers should ideally be broken out on the P&L, and retention should be calculated both overall and on the preferred segment(s).
Scenario: One-Time Buyouts/Terminations
This one is easy. Just like a one-time initiation isn’t really MRR, a penalty for early termination isn’t either. Don’t put it in your retention numbers, thinking you’ll get a great bump in NRR – all you’re doing is putting a massive downward pressure on next year’s GRR.
You should also not “pay out” the termination over the remaining contract period, thinking it will ease the blow: once your service obligation is done just take the MRR for that customer down to zero. The faster the “medicine” of a loss in MRR is taken, the faster GRR can recover down the road.
Scenario: Multi-Currency Sales
(If you operate in a single currency, save yourself the headache and skip this one.) Say you sell annual contract SaaS, priced for some customers in U.S. dollars, some in euros, and some in pounds sterling, and that your customers are enterprises who pay annually in advance, but on net-30 invoicing terms. If you’ve got professional “by the books” accountants, there’s a good chance you’ll have monthly accounting entries for realized and unrealized currency effects on the balance sheet items that result: A/Rs for unpaid invoices, deferred revenue for paid invoices early in the term, and possibly local currency denominated bank accounts where these payments are received. Your GAAP (or IFRS) balance sheet accounts and monthly revenue figures are going to bounce around as forex rates move.
In this case, you’re going to need to accept a divergence between P&L revenue and your retention calculation revenue. Do not try to use monthly GAAP accruals for retention. Instead, calculate the MRR to be accrued according to your accounting currency at the time of the contract (or the change/renewal to the contract). You’ll still have some potential artificial reduction in GRR because of the potential for volatility in contract value from exchange rate changes at each year’s renewal, but you won’t have the maddening movement month-to-month of MRR that can wreak havoc on retention metrics each month.
Overarching principles for making retention metrics useful as KPIs:
- A major goal with SaaS retention calcs is for you and outside stakeholders to be able to compare your performance meaningfully with other comparables. So don’t use custom or overly sophisticated cohort analyses.
- Compare month to year-ago month and then track 3-, 6-, and 12-month averages. Don’t use “monthly churn” or quarter-to-prior-quarter comparisons.
- Your MRR used in retention calculations should usually match the accrual method recognized subscription revenue for the month shown on the P&L.
- However, “seasoning” or segmenting MRR (such as ICP vs non-ICP) can sometimes create better insight or clarity, and can justify departing from P&L recognized revenue in your retention calcs.
- Disclose in your reporting any such departure from using the P&L rec rev for retention, and be consistent with a written policy.
- Though it’s best if historical MRR (and hence retention) never changes, real-life situations such as refunds and credits sometimes make it better to go back and restate MRR and retention.
- Accept that volatility in what you count as MRR, such as usage-based revenue, will strictly lower GRR vs. a pure subscription model. Be ready to explain this and accept the tradeoff if the growth in NRR can justify it.
Our Approach
Who Is SaaS Capital?
SaaS Capital® is the leading provider of long-term Credit Facilities to SaaS companies.
Read MoreSubscribe